 By
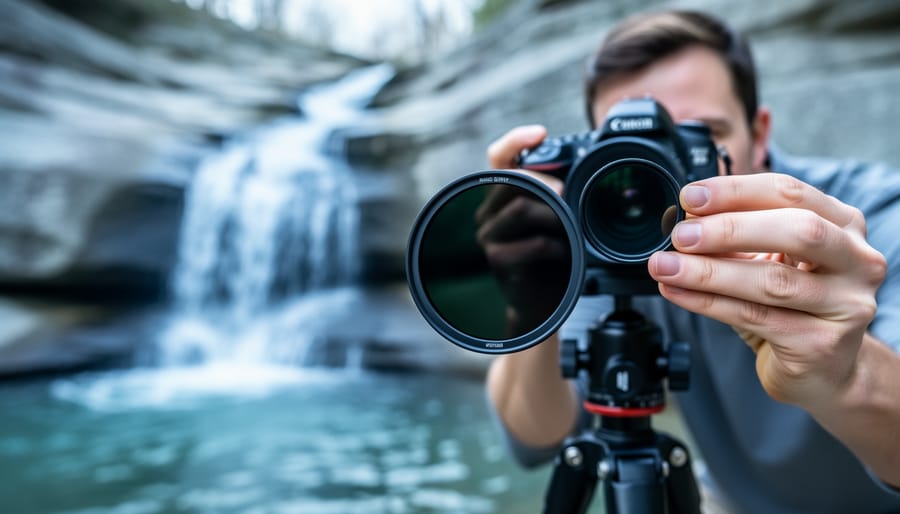
An MDE calculator, in the photographic sense, is a quick way to find out how far your ND filter’s real density strays from the number printed on its rim, then correct your exposure to match. The whole job takes about 15 minutes, needs only a camera, a tripod, and a steady light source, and it’s easy enough for a beginner to repeat in the field. Some background on the term first. Statisticians use MDE for Minimum Detectable Effect, a different tool entirely. Here we mean something more practical: the measured density error, a working definition rather than an industry standard.
Why bother? A filter labeled ND 3.0 should cut exactly 10 stops of light. In practice, coatings, glass thickness, and manufacturing tolerances can leave it a third of a stop or more off, and that gap adds up fast during a 90-second exposure of a waterfall. If you’ve ever pulled a long-exposure frame that came out darker or brighter than your meter promised, this is likely the culprit. Compare a metered reading with and without the filter, convert the difference to stops, and you’ll know the true density to within a fraction of a stop. From there, you can adjust shutter speed and trust your results.
What an MDE Calculator Tells You About Your ND Filter
“Measured density error” is a working term, not an industry standard. It simply means the gap, in stops, between the strength printed on your filter and the light it actually blocks. A filter labeled 10 stops that really cuts 9.3 has a measured density error of 0.7 stops. That’s the number a good calculator hands you.
A few terms make this easier to follow. Optical density (OD) is how strongly a filter darkens a scene, written on a log scale. A “stop” is one halving of light. Transmission is the percentage of light that gets through. The handy rule of thumb: 0.3 OD is roughly 1 stop, so ND 3.0 should land near 10 stops, which is about 0.1% transmission.
Why would a filter miss its label? Manufacturing tolerance is the big one, since coating thickness varies from batch to batch. Coatings can also absorb unevenly across the spectrum. Stacking two filters rarely adds up as cleanly as the math suggests, because reflections and slight errors compound. Variable NDs add their own quirks, especially near the darkest end of the rotation ring.
Here’s how it plays out. Say you’re shooting a waterfall at dawn, and your “10-stop” filter actually behaves like 9. You calculate a 30-second exposure, but you needed 60. Your silky water comes out blown-out and gray. If it’s really closer to 11 stops, you’re underexposed and fighting noise in the shadows.
That’s why measuring beats trusting the label, and it’s what the rest of this guide walks you through.
Tools and Materials for a Reliable Density Test
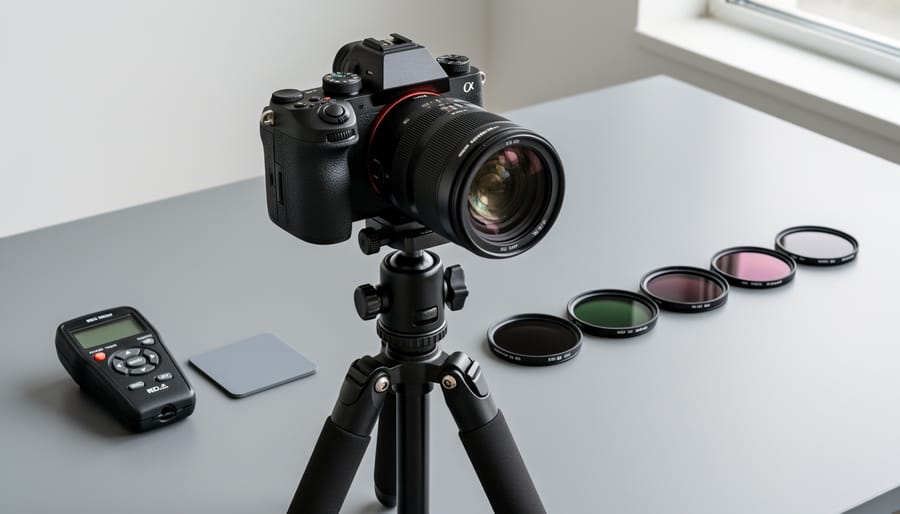
You don’t need much gear to test an ND filter, but each piece below removes one source of error, so don’t skip the basics.
- A camera with manual mode: you need full control of shutter speed, aperture and ISO so nothing shifts between frames.
- A sturdy tripod: it keeps the framing identical between the reference shot and the filtered shot.
- The ND filter (or filters) under test: clean and unscratched, so you’re measuring density rather than damage.
- A stable, evenly lit scene: a neutral gray card or a plain, evenly lit wall gives you a clean tonal reference.
- The ND Filter Density Test & Exposure Calculator: it turns your two shutter speeds into measured stops and error.
- Optional handheld light meter: it gives you an independent cross-check on your reference exposure.
- A remote release or 2-second timer: it prevents the shake that comes from pressing the shutter button.
- A lens cloth: fingerprints and dust on the filter will skew your readings.
Two terms are worth defining if you’re newer to this. Manual exposure means you set shutter speed, aperture and ISO yourself instead of letting the camera decide. The histogram is the graph on your camera’s display showing how bright or dark your image is. For this test, you want the main hump sitting near the middle, not jammed against either edge.
Light matters as much as gear. A sunny window or a evenly overcast sky gives you a steady source, while shifting clouds change the brightness between frames and quietly ruin your numbers. If the light is changing, wait it out or move indoors. Never use the sun itself as your light source, as we’ll cover in the safety section next.
Safety Warnings: Protect Your Eyes, Sensor, and Gear
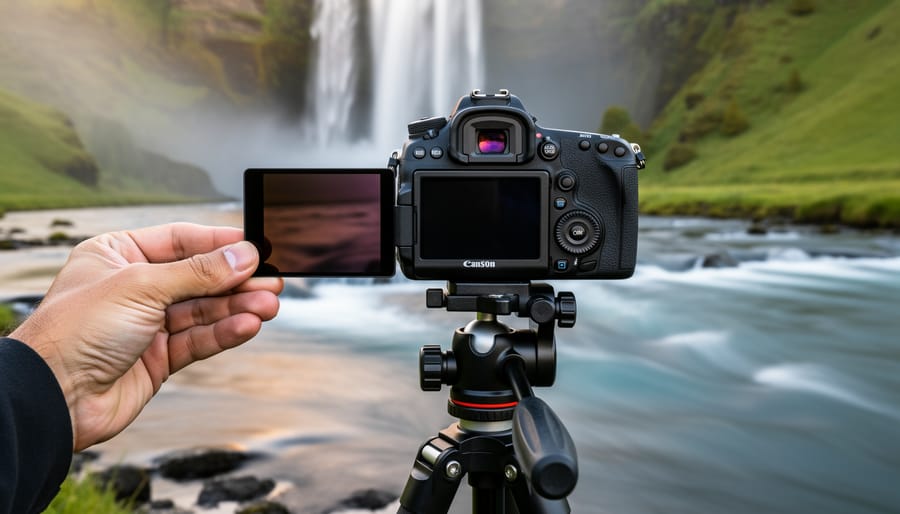
Before you start shooting test frames, a few cautions are worth a minute of your attention, because a density test is only useful if you and your gear come through it intact.
Even a very dark ND filter does not block enough of the sun’s visible and infrared energy to protect your eyes or your sensor. Stick with an overcast sky, a sunny window, or an evenly lit gray card instead. For the same reason, avoid pointing an optical viewfinder at any bright source while you test. Use live view or the rear screen, and keep the lens aimed at your evenly lit target.
Handle glass filters carefully. Work over a soft surface like a camera bag or towel, not concrete or tile, because a single drop can crack or chip the glass. When cleaning, use a blower and a clean microfiber cloth with lens-safe fluid. Abrasive wipes, paper towels, or shirt hems can scratch the coating and change how the filter performs.
Know when to stop. If your readings swing wildly from frame to frame, or you spot scratches, haze, or delaminating coatings, retire the filter. Calculating around damage only gives you a number you can’t trust, and replacing it is the safer route for good long-exposure settings.
Step-by-Step: Measuring Your Filter and Running the Calculator
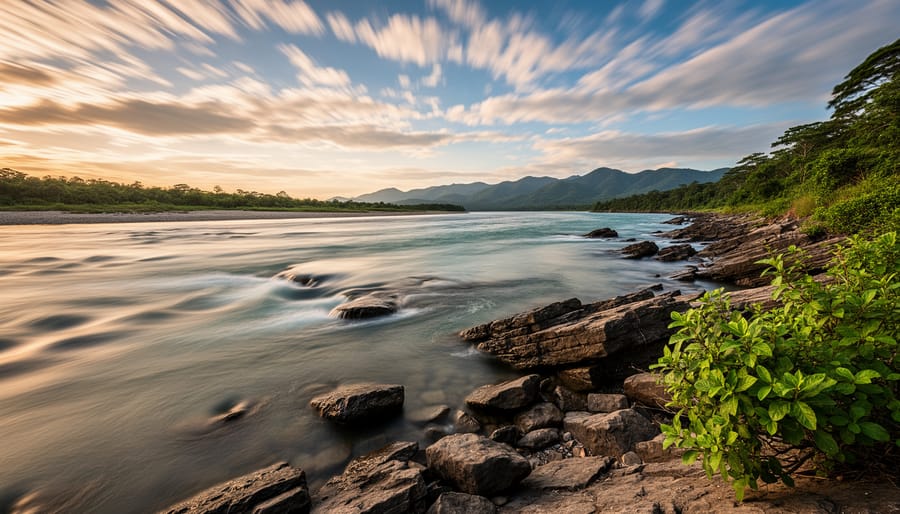
The whole test comes down to one idea: shoot the same scene twice, once bare and once filtered, and let the shutter speed difference reveal how much light the filter really blocks. Everything else is about keeping every other variable frozen so the shutter speed is the only thing that changes.
Here’s the sequence, start to finish:
- Mount the camera on the tripod and point it at an evenly lit scene, such as a gray card or a plain wall in steady daylight. Turn off any image stabilization.
- Switch to manual mode. Set a fixed ISO (100 or your base ISO), a fixed aperture (f/8 is a safe, sharp choice), and a fixed white balance preset instead of auto.
- Take a reference exposure without the filter. Adjust only the shutter speed until the histogram sits comfortably in the middle, with no clipping at either end. Note that shutter speed.
- Attach the filter, keeping the framing and focus exactly as they were. If you use autofocus, focus first and then switch to manual so the lens doesn’t hunt.
- Lengthen the shutter speed, changing nothing else, until the filtered histogram matches the reference. Use a remote release or 2-second timer to avoid shake.
- Record both shutter speeds, the aperture, the ISO, and the density printed on the filter.
- Enter those five values into the ND Filter Density Test & Exposure Calculator and read the measured stops, optical density, and the error against the label.
Here’s a worked example. Say your reference frame at f/8 and ISO 100 needs 1/60 s. You attach a filter labeled 10 stops (OD 3.0) and, after matching the histogram, land on 8 seconds. The calculator compares 1/60 s with 8 s, a ratio of 480, which is about 8.9 stops. That’s roughly OD 2.7, so this “10-stop” filter is really closer to a 9-stop. The error is about 1.1 stops, which is plenty to wreck a waterfall exposure if you trust the label.
One practical wrinkle: very long filtered exposures can bump into your camera’s maximum shutter speed in manual mode, and if you’re working in bright light, your reference shot might push against its own shutter speed limits. If that happens, stop down the aperture or drop to a lower ISO for the whole test, then keep those new values fixed.
Light is rarely perfectly constant, even on a sunny day, so a single pair of frames can mislead you. Run the test three times, take the three measured-stop results, and average them. If one run is wildly off from the other two, a cloud probably drifted past, so toss it and reshoot. This kind of repeat testing is what separates a trustworthy number from a lucky one.
A couple of quick checks while you work. Match the histogram’s shape, not just the camera’s meter reading, because a dark ND filter can fool the meter. And don’t chase tiny differences: if your filtered frame is within about a third of a stop of the reference, you’re in good shape, and the calculator will tell you the rest.
Reading Your Results: From Density to Corrected Exposure
Once the calculator gives you a measured value, you’ll usually see it expressed in several ways at once. They all describe the same thing, so here’s how to read each one.
Optical density (OD) to stops. Divide the OD by 0.3. A measured OD of 2.7 equals 9 stops. A filter labeled 3.0 (10 stops) that measures 2.7 is losing a full stop less light than it claims.
Stops to transmission. Transmission is the fraction of light that gets through, calculated as 1 ÷ 2^stops. At 9 stops, that’s 1/512, or about 0.2 percent. At 10 stops, it’s 1/1024, or about 0.1 percent. That gap looks tiny as a percentage, but it’s a full doubling of light.
Stops to filter factor. The filter factor is the number you multiply your shutter speed by. For 9 stops, it’s 512. For 10 stops, it’s 1024.
Applying the measured value. Suppose your unfiltered meter reading is 1/15 second at f/11 and ISO 100, and you’re using that “10-stop” filter. Trusting the label, you’d multiply by 1024 and shoot about 68 seconds. But your test showed it’s really a 9-stop filter, so the correct factor is 512. That gives roughly 34 seconds, and the 68-second exposure would be a full stop too bright.
Here’s a smaller case with a 30-second target. If the label says 6 stops (factor 64) but you measured 6.5 stops (factor about 90), then a scene that reads 1/2 second unfiltered needs about 45 seconds, not 32. Always plug the measured number into your planning.
What’s worth acting on. Here’s a practical rule of thumb, not an industry standard:
– Under about 1/3 stop of error: within normal tolerance. Most photographers won’t notice, and raw files can absorb it.
– Between 1/3 and 2/3 stop: worth noting on the filter, especially for bright skies where highlights clip easily.
– Over 2/3 stop: correct for it every time, or consider replacing the filter.
Also note which direction the error runs. A filter that’s darker than labeled gives you a dim image you can recover, while one that’s lighter than labeled risks irreversible blown highlights.
Verification and Next Steps: Confirming the Numbers in the Field
A calculator gives you a number, but only the field can confirm it. Start by reshooting with the corrected exposure. Use your measured stops, not the label, to set the shutter speed, then check the histogram. If the main hump of tones sits comfortably mid-range without piling against either edge, your density value holds up.
Next, test a second scene or a different time of day. A filter that behaves on a gray card at noon should behave on a seascape at dusk. If the corrected exposure drifts noticeably, your light was probably unstable during the original test, so repeat it. If you own a handheld light meter, take a reading with and without the filter as a quick cross-check against the calculator’s result.
Once you trust the number, put it where you’ll see it:
1. Write the measured value on a small piece of tape stuck to the filter case, or log it in your gear notes.
2. Retest after heavy use, a hard cleaning, or any scratch or coating wear.
3. Test stacked filters as a pair or trio, not individually, because errors add together. Two filters that are each half a stop off can leave you a full stop wrong.
From here, build a personal exposure chart for your long-exposure landscapes. List each filter or stack alongside its true stop value and the shutter speeds you’d use at your usual apertures and ISO. Keep it on your phone so it’s with you on location. It’s the same habit-building mindset behind understanding print resolution before you size a file for output: a little verified groundwork saves you from disappointment later.
Common Pitfalls That Skew Your Density Test
A bad reading usually traces back to one of a handful of habits. Here are the ones that trip people up most, with the quick fix for each:
- Changing light between frames: clouds or a dimming window shift your reference. Shoot the filtered and unfiltered frames back to back, and repeat the test three times.
- Auto ISO or auto white balance left on: the camera quietly “corrects” what you’re trying to measure. Lock ISO and set a fixed white balance before the first frame.
- Color casts and infrared leakage on dark ND filters: some filters pass extra IR, which warms the image and throws off brightness. Use a custom white balance on your gray card, and add an IR-cut filter if the shift is strong.
- Variable ND cross-polarization: turning the ring too far creates dark bands and uneven density. Back off from the extreme end of the range and test at a fixed ring position.
- Vignetting from stacked filters: dark corners drag down your average brightness. Zoom in slightly or meter from the center of the frame only.
- Light leaks through the viewfinder: on long shutters, stray light sneaks in through the eyepiece. Close the viewfinder shutter or cover the eyepiece with a cap or piece of tape.
Most of these only cause trouble when you’re rushing. Slow down, change one thing at a time, and you’ll catch the culprit fast. If your numbers still look odd after fixing these, it may be worth a broader check to test your camera performance and rule out a gear issue that has nothing to do with the filter.
Frequently Asked Questions About Testing ND Filter Density
What does MDE mean in this context?
It’s shorthand for “measured density error,” meaning the gap in stops between your filter’s labeled strength and what it actually delivers. It isn’t an established photography term, and elsewhere it usually stands for Minimum Detectable Effect in statistics.
How much error is acceptable?
A few tenths of a stop is normal manufacturing tolerance and rarely changes a long exposure in a way you’d notice. Once the gap approaches a full stop, it’s worth correcting your shutter speed using the measured value instead of the label.
Do I need a light meter?
No. Your camera’s histogram and a fixed, evenly lit scene are enough for a solid test. A handheld meter is a nice cross-check, not a requirement.
Can I test a variable ND filter?
Yes, but test it at the specific settings you actually use, since the density changes as you rotate the ring. Watch for uneven darkening or cross-polarization banding at the extreme end, because those can throw off your readings.
Dark ND filters often shift color because they don’t block every wavelength equally, and some pass extra infrared. Lock your white balance during the test, then correct the cast in post or with a custom white balance. If your frames still look inconsistent after that, it’s smart to check your shutter behavior before blaming the filter.
As for retesting, a quick recheck after heavy use, a deep cleaning, or any visible scratch keeps your numbers honest. Otherwise, once or twice a year is plenty for filters that live safely in their case.
A filter’s label is a starting point, not a guarantee. With a tripod, a steady light source, and a few minutes of testing, you can turn “10-stop” into the number your filter actually delivers, and that number is the one you should trust when the light is fading and you only get one shot at the shutter speed.
Start with the filter you reach for most often. Measure it, note the result on a piece of tape or in your gear log, and use that corrected value from now on. Once you’ve seen the difference between the printed density and the real one, you’ll probably want to check the rest of your kit.
Before your next long-exposure outing, run your numbers through the ND Filter Density Test & Exposure Calculator and head out with settings you can rely on.

 By